
3.2E : Exercices pour la section 3.2
- Page ID
- 197889
Pour les exercices 1 à 10, utilisez la définition d'une dérivée pour trouver\(f′(x)\).
1)\(f(x)=6\)
2)\(f(x)=2−3x\)
- Réponse
- \(f'(x) = −3\)
3)\(f(x)=\dfrac{2x}{7}+1\)
4)\(f(x)=4x^2\)
- Réponse
- \(f'(x) = 8x\)
5)\(f(x)=5x−x^2\)
6)\(f(x)=\sqrt{2x}\)
- Réponse
- \(f'(x) = \dfrac{1}{\sqrt{2x}}\)
7)\(f(x)=\sqrt{x−6}\)
8)\(f(x)=\dfrac{9}{x}\)
- Réponse
- \(f'(x)=\dfrac{−9}{x^2}\)
9)\(f(x)=x+\dfrac{1}{x}\)
10)\(f(x)=\dfrac{1}{\sqrt{x}}\)
- Réponse
- \(f'(x)=\dfrac{−1}{2x^{3/2}}\)
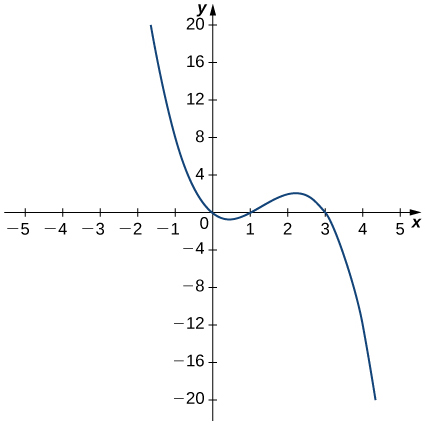
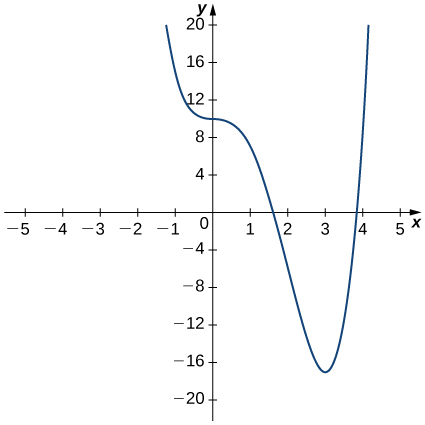
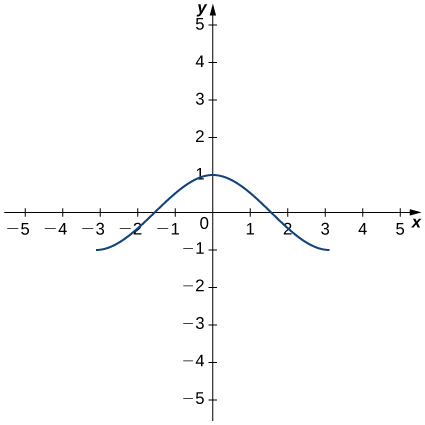
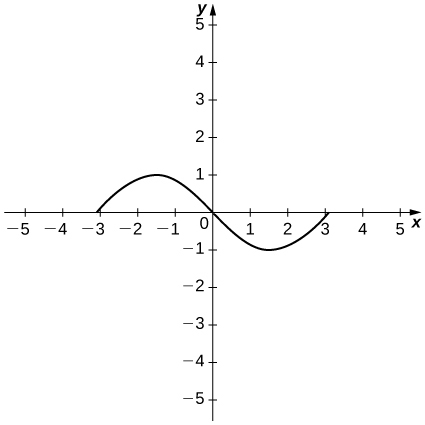
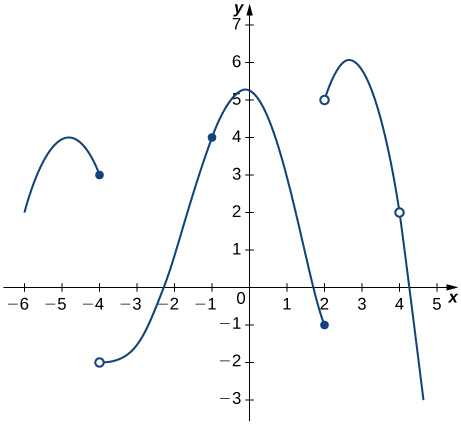
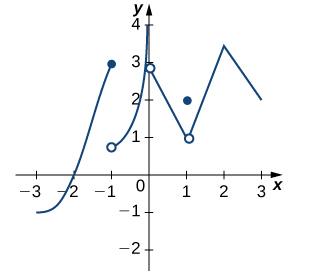
Pour les exercices 11 à 14, utilisez le graphe de\(y=f(x)\) pour esquisser le graphe de sa dérivée\(f′(x)\).
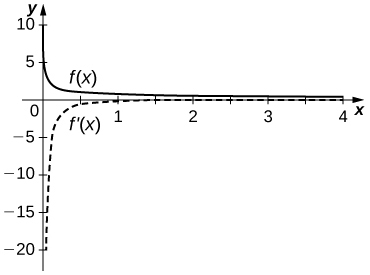
11)
(12)
- Réponse
-
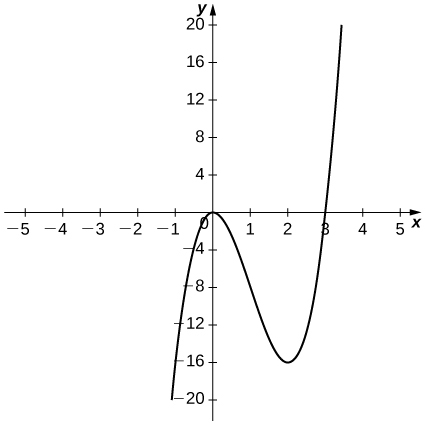
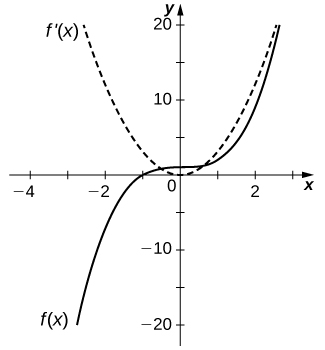
13)
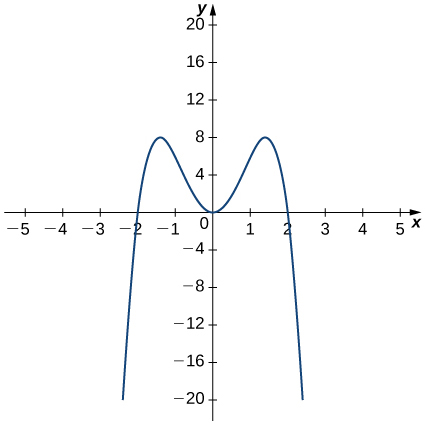
(14)
- Réponse
-
Pour les exercices 15 à 20, la limite donnée représente la dérivée d'une fonction\(y=f(x)\) à\(x=a\). Trouvez\(f(x)\) et\(a\).
15)\(\displaystyle \lim_{h→0}\frac{(1+h)^{2/3}−1}{h}\)
16)\(\displaystyle \lim_{h→0}\frac{[3(2+h)^2+2]−14}{h}\)
- Réponse
- \(f(x)=3x^2+2, \quad a=2\)
17)\(\displaystyle \lim_{h→0}\frac{\cos(π+h)+1}{h}\)
18)\(\displaystyle \lim_{h→0}\frac{(2+h)^4−16}{h}\)
- Réponse
- \(f(x)=x^4, \quad a=2\)
19)\(\displaystyle \lim_{h→0}\frac{[2(3+h)^2−(3+h)]−15}{h}\)
(20)\(\displaystyle \lim_{h→0}\frac{e^h−1}{h}\)
- Réponse
- \(f(x)=e^x, \quad a=0\)
Pour les fonctions des exercices 21 à 24,
a. esquissez le graphique et
b. utilisez la définition d'une dérivée pour montrer que la fonction n'est pas dérivable à\(x=1\).
(21)\(f(x)=\begin{cases}2\sqrt{x}, & \text{if } 0≤x≤1\\3x−1, & \text{if } x>1\end{cases}\)
(22)\(f(x)=\begin{cases}3, & \text{if } x<1\\3x, & \text{if } x≥1\end{cases}\)
- Réponse
-
un.
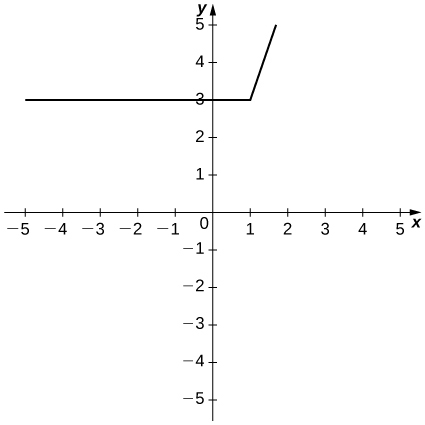
b.\(\displaystyle \lim_{h→1^−}\frac{3−3}{h}≠\lim_{h→1^+}\frac{3h}{h}\)
23)\(f(x)=\begin{cases}−x^2+2, & \text{if } x≤1\\x, & \text{if } x>1\end{cases}\)
(24)\(f(x)=\begin{cases}2x, & \text{if } x≤1\\\frac{2}{x}, & \text{if } x>1\end{cases}\)
- Réponse
-
un.
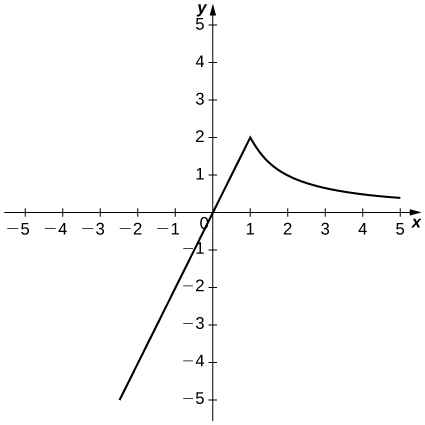
b.\(\displaystyle \lim_{h→1^−}\frac{2h}{h}≠\lim_{h→1^+}\frac{\frac{2}{x+h}−2x}{h}.\)
For the graphs in exercises 25 - 26,
a. determine for which values of \(x=a\) the \(\displaystyle \lim_{x→a}f(x)\) exists but \(f\) is not continuous at \(x=a\), and
b. determine for which values of \(x=a\) the function is continuous but not differentiable at \(x=a\).
25)
26)
- Answer
- a. \(x=1\),
b. \(x=2\)
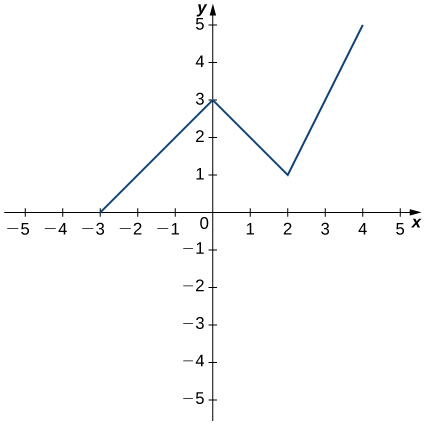
27) Use the graph to evaluate a. \(f′(−0.5)\), b. \(f′(0)\), c. \(f′(1)\), d. \(f′(2)\), and e. \(f′(3),\) if it exists.
For the functions in exercises 28 - 30, use \(f''(x)=\displaystyle \lim_{h→0}\frac{f′(x+h)−f′(x)}{h}\) to find \(f''(x).\)
28) \(f(x)=2−3x\)
- Answer
- \(f''(x)=0\)
29) \(f(x)=4x^2\)
30) \(f(x)=x+\dfrac{1}{x}\)
- Answer
- \(f''(x)=\dfrac{2}{x^3}\)
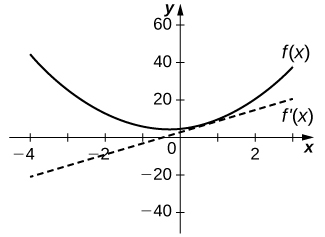
For exercises 31 - 36, use a calculator to graph \(f(x)\). Determine the function \(f′(x)\), then use a calculator to graph \(f′(x)\).
31) [T] \(f(x)=−\dfrac{5}{x}\)
32) [T] \(f(x)=3x^2+2x+4.\)
- Answer
-
\(f′(x)=6x+2\)
33) [T] \(f(x)=\sqrt{x}+3x\)
34) [T] \(f(x)=\dfrac{1}{\sqrt{2x}}\)
- Answer
-
\(f′(x)=−\dfrac{1}{(2x)^{3/2}}\)
35) [T] \(f(x)=1+x+\dfrac{1}{x}\)
36) [T] \(f(x)=x^3+1\)
- Answer
-
\(f′(x)=3x^2\)
For exercises 37 - 42, describe what the two expressions represent in terms of each of the given situations. Be sure to include units.
a. \(\dfrac{f(x+h)−f(x)}{h}\)
b. \(f′(x)=\displaystyle \lim_{h→0}\frac{f(x+h)−f(x)}{h}\)
37) \(P(x)\) denotes the population of a city at time \(x\) in years.
38) \(C(x)\) denotes the total amount of money (in thousands of dollars) spent on concessions by \(x\) customers at an amusement park.
- Answer
-
a. Average rate at which customers spent on concessions in thousands per customer.
b. Rate (in thousands per customer) at which \(x\) customers spent money on concessions in thousands per customer.
39) \(R(x)\) denotes the total cost (in thousands of dollars) of manufacturing \(x\) clock radios
40) \(g(x)\) denotes the grade (in percentage points) received on a test, given \(x\) hours of studying.
- Answer
-
a. Average grade received on the test with an average study time between two values.
b. Rate (in percentage points per hour) at which the grade on the test increased or decreased for a given average study time of \(x\) hours.
41) \(B(x) \)denotes the cost (in dollars) of a sociology textbook at university bookstores in the United States in \(x\) years since \(1990\).
42) \(p(x)\) denotes atmospheric pressure at an altitude of \(x\) feet.
- Answer
-
a. Average change of atmospheric pressure between two different altitudes.
b. Rate (torr per foot) at which atmospheric pressure is increasing or decreasing at \(x\) feet.
43) Sketch the graph of a function \(y=f(x)\) with all of the following properties:
a. \(f′(x)>0\) for \(−2≤x<1\)
b. \(f′(2)=0\)
c. \(f′(x)>0\) for \(x>2\)
d. \(f(2)=2\) and \(f(0)=1\)
e. \(\displaystyle \lim_{x→−∞}f(x)=0\) and \(\displaystyle \lim_{x→∞}f(x)=∞\)
f. \(f′(1)\) does not exist.
44) Suppose temperature \(T\) in degrees Fahrenheit at a height \(x\) in feet above the ground is given by \(y=T(x).\)
a. Give a physical interpretation, with units, of \(T′(x).\)
b. If we know that \(T′(1000)=−0.1,\) explain the physical meaning.
- Answer
-
a. The rate (in degrees per foot) at which temperature is increasing or decreasing for a given height \(x.\)
b. The rate of change of temperature as altitude changes at \(1000\) feet is \(−0.1\) degrees per foot.
45) Suppose the total profit of a company is \(y=P(x)\) thousand dollars when \(x\) units of an item are sold.
a. What does \(\dfrac{P(b)−P(a)}{b−a}\) for \(0<a<b\) measure, and what are the units?
b. What does \(P′(x)\) measure, and what are the units?
c. Suppose that \(P′(30)=5\), what is the approximate change in profit if the number of items sold increases from \(30\) to \(31\)?
46) The graph in the following figure models the number of people \(N(t)\) who have come down with the flu t weeks after its initial outbreak in a town with a population of 50,000 citizens.
a. Describe what \(N′(t)\) represents and how it behaves as \(t\) increases.
b. What does the derivative tell us about how this town is affected by the flu outbreak?
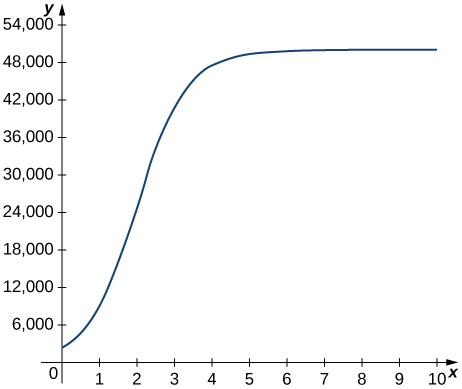
- Answer
- a. The rate at which the number of people who have come down with the flu is changing \(t\) weeks after the initial outbreak.
b. The rate is increasing sharply up to the third week, at which point it slows down and then becomes constant.
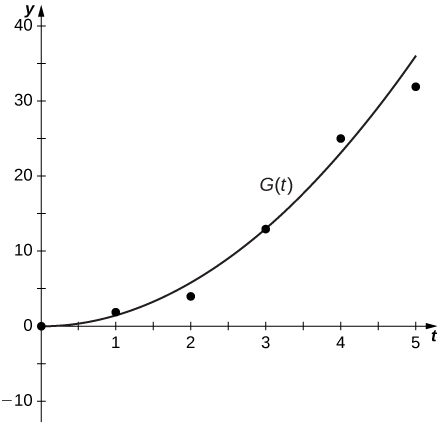
For exercises 47 - 52, use the following table, which shows the height \(h\) of the Saturn V rocket for the Apollo 11 mission \(t\) seconds after launch.
| Time (seconds) | Height (meters) |
| 0 | 0 |
| 1 | 2 |
| 2 | 4 |
| 3 | 13 |
| 4 | 25 |
| 5 | 32 |
47) What is the physical meaning of \(h′(t)\)? What are the units?
48) [T] Construct a table of values for \(h′(t)\) and graph both \(h(t)\) and \(h′(t)\) on the same graph. (Hint: for interior points, estimate both the left limit and right limit and average them.)
- Answer
-
Time (seconds) \(h′(t)\) (m/s) 0 2 1 2 2 5.5 3 10.5 4 9.5 5 7
49) [T] The best linear fit to the data is given by \(H(t)=7.229t−4.905\), where \(H\) is the height of the rocket (in meters) and t is the time elapsed since takeoff. From this equation, determine \(H′(t)\). Graph \(H(t\) with the given data and, on a separate coordinate plane, graph \(H′(t).\)
50) [T] The best quadratic fit to the data is given by \(G(t)=1.429t^2+0.0857t−0.1429,\) where \(G\) is the height of the rocket (in meters) and \(t\) is the time elapsed since takeoff. From this equation, determine \(G′(t)\). Graph \(G(t)\) with the given data and, on a separate coordinate plane, graph \(G′(t).\)
- Answer
-
\(G′(t)=2.858t+0.0857\)
51) [T] The best cubic fit to the data is given by \(F(t)=0.2037t^3+2.956t^2−2.705t+0.4683\), where \(F\) is the height of the rocket (in m) and \(t\) is the time elapsed since take off. From this equation, determine \(F′(t)\). Graph \(F(t)\) with the given data and, on a separate coordinate plane, graph \(F′(t)\). Does the linear, quadratic, or cubic function fit the data best?
52) Using the best linear, quadratic, and cubic fits to the data, determine what \(H''(t),\;G''(t)\text{ and }F''(t)\) are. What are the physical meanings of \(H''(t),\;G''(t )\text{ and }F''(t),\) and what are their units?
- Answer
- \(H''(t)=0,\;G''(t)=2.858\text{ and }f''(t)=1.222t+5.912\) represent the acceleration of the rocket, with units of meters per second squared \((\text{m/s}^2).\)