46.1: 生态系统生态学
- Page ID
- 202901
培养技能
- 描述地球上生态系统的基本类型
- 解释生态学家用来研究生态系统结构和动态的方法
- 确定生态系统建模的不同方法
- 区分食物链和食物网,并认识到每种食物链和食物网的重要性
生态系统中的生活往往是争夺有限的资源,这是自然选择理论的特征。 无论是在物种内部还是在不同物种之间,都可以观察到群落(特定栖息地内的所有生物)之间的竞争。 生物争夺的资源包括来自活体或以前活过的生物体的有机物质、阳光和矿物质营养素,它们为生命过程提供能量和构成生物体物理结构的物质。 影响群落动态的其他关键因素是其物理和地理环境的组成部分:栖息地的纬度、降雨量、地形(海拔)和可用物种。 这些都是重要的环境变量,它们决定了特定区域内可以存在哪些生物。
生态系统是活生物体及其与非生物(非生物)环境相互作用的群落。 生态系统可以很小,例如在许多海洋的岩石海岸附近发现的潮汐池,也可以很大,例如巴西的亚马逊雨林(图\(\PageIndex{1}\))。

根据其总体环境,生态系统分为三大类:淡水、海水和陆地。 根据存在的生物和环境栖息地的类型,这些大类中有个别的生态系统类型。
海洋生态系统是最常见的,占地球表面的75%,由三种基本类型组成:浅海、深海水和深海表面(深海的低深区域)。 浅海生态系统包括极具生物多样性的珊瑚礁生态系统,深海表面以支持它的大量浮游生物和磷虾(小型甲壳类动物)而闻名。 这两种环境对全球有氧呼吸器尤其重要,因为浮游植物发挥了地球上所有光合作用的40%。 尽管不像其他两个生态系统那样多样化,但深海生态系统包含各种各样的海洋生物。 这样的生态系统甚至存在于光线无法穿透水面的海底。
淡水生态系统是最稀有的,仅存在于地球表面的1.8%。 湖泊、河流、溪流和泉水构成了这些系统;它们非常多样化,它们支持各种鱼类、两栖动物、爬行动物、昆虫、浮游植物、真菌和细菌。
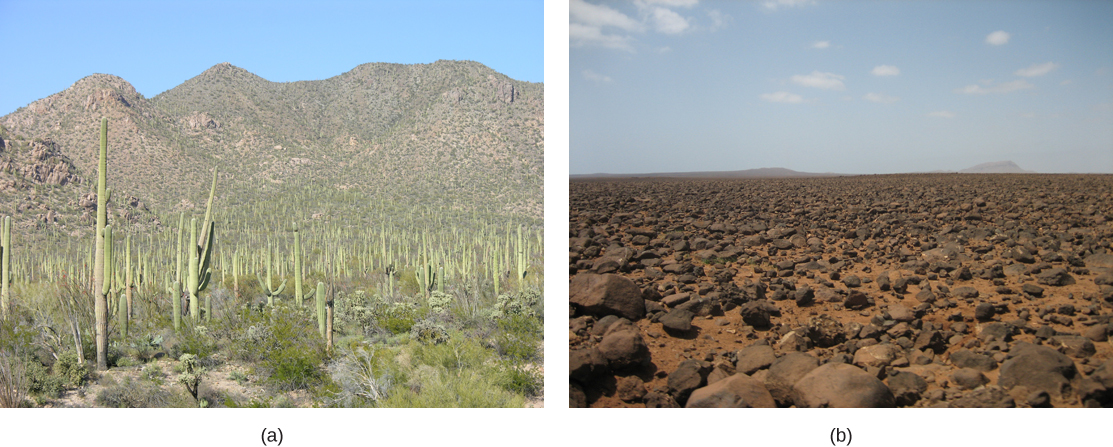
陆地生态系统也以其多样性而闻名,分为称为生物群落的大类,例如热带雨林、稀树草原、沙漠、针叶林、落叶林和苔原。 将这些生态系统分为几个生物群落类别掩盖了其中各个生态系统的巨大多样性。 例如,沙漠植被差异很大:与西非沿海岛屿博阿维斯塔荒凉的岩石沙漠相比,美国索诺兰沙漠中的仙人掌和其他植物生命相对丰富(图\(\PageIndex{2}\))。

生态系统很复杂,有许多相互作用的部分。 它们经常受到各种干扰或影响其成分的环境变化:降雨量和温度的年度变化以及植物生长过程较慢,这可能需要数年时间。 这些干扰中有许多是自然过程的结果。 例如,当闪电引发森林火灾并摧毁部分森林生态系统时,地面最终会由草丛组成,然后是灌木和灌木,然后是成熟的树木,从而使森林恢复到原来的状态。 人类活动造成的环境干扰的影响与自然过程造成的变化同样重要。 人类农业行为、空气污染、酸雨、全球森林砍伐、过度捕捞、富营养化、漏油以及陆地和海洋中的非法倾倒都是环保主义者关注的问题。
平衡是生态系统的稳定状态,在这种状态下,所有生物都与环境以及彼此保持平衡。 在生态学中,两个参数用于衡量生态系统的变化:抵抗力和复原力。 生态系统在受到干扰的情况下仍能保持平衡的能力称为抵抗力。 生态系统在受到干扰后恢复平衡的速度称为其弹性。 在考虑人类影响时,生态系统的抵抗力和复原力尤其重要。 生态系统的性质可能会发生变化,以至于它可能完全失去复原力。 这个过程可能导致生态系统的彻底破坏或不可逆转的改变。
食物链和食物网
“食物链” 一词有时被隐喻地用来描述人类的社会状况。 从这个意义上讲,食物链被认为是生存的竞争,例如 “谁吃谁?” 有人吃东西有人被吃掉了。 因此,不足为奇的是,在我们竞争激烈的 “狗吃狗” 社会中,被认为成功的人被视为食物链的顶端,为了自己的利益而消耗所有其他人,而不太成功的人则被视为处于最底层。
对食物链的科学理解比对食物链的日常使用更为精确。 在生态学中,食物链是养分和能量经过的线性生物序列:初级生产者、初级消费者和更高级别的消费者被用来描述生态系统的结构和动态。 链条中只有一条路径。 食物链中的每个生物都占据所谓的营养等级。 根据其作为生产者或消费者的角色,可以将物种或物种群分配到不同的营养级别。
在许多生态系统中,食物链的底层由光合生物(植物和/或浮游植物)组成,它们被称为初级生产者。 消耗初级生产者的生物是食草动物:主要消费者。 二级消费者通常是食用主要消费者的食肉动物。 三级消费者是吃其他食肉动物的食肉动物。 更高级别的消费者以下一个较低的热带水平为食,依此类推,直至食物链顶端的生物:顶端消费者。 在图中所示的安大略湖食物链中\(\PageIndex{3}\),奇努克鲑鱼是该食物链顶端的主要消费者。

限制食物链长度的一个主要因素是能量。 由于热力学第二定律,能量在每个营养等级之间以热量形式流失。 因此,在有限数量的营养能量转移之后,食物链中剩余的能量可能不足以在更高的营养水平上支持有生存能力的种群。
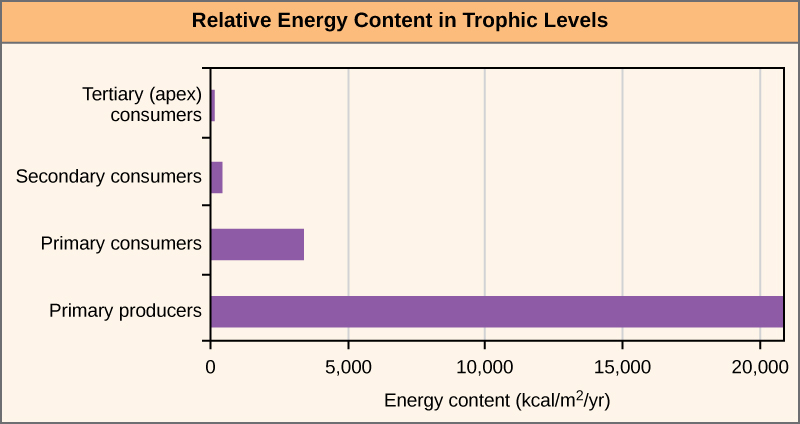
20 世纪 40 年代霍华德·奥杜姆在佛罗里达州银泉生态系统中的开创性研究说明了营养级之间的能量损失(图\(\PageIndex{4}\))。 初级生产者每年产生20,819千卡/米(每年每平方米千卡),初级消费者每年产生3368千卡/米,二级消费者每年产生383千卡/m 2,三级消费者每年仅产生21千卡/m 2。 因此,在这个生态系统中,其他层次的消费者几乎没有剩余的能量。

使用食物链准确描述大多数生态系统时有一个问题。 即使将所有生物分为适当的营养等级,其中一些生物也可以以多个营养级别的物种为食;同样,其中一些生物可以被多个营养级别的物种吃掉。 换句话说,生态系统的线性模型,即食物链,并不完全描述生态系统的结构。 整体模型——它考虑了不同物种之间的所有相互作用及其彼此之间以及与环境之间复杂的相互关联关系——是一种更准确、更具描述性的生态系统模型。 食物网是初级生产者、初级消费者和更高层次消费者的整体、非线性网络的图形表示,用于描述生态系统的结构和动态(图\(\PageIndex{5}\))。

对两种类型的结构生态系统模型的比较表明,这两种模型都有优势。 食物链在分析建模方面更灵活,更易于理解,更易于实验,而食物网模型更准确地表示生态系统的结构和动态,数据可以直接用作仿真建模的输入。
链接到学习

前往这个在线互动模拟器来研究食物网的功能。 在 “互动实验室” 框的 F ood Web 下,单击 “步骤 1”。 请先阅读说明,然后单击 “步骤 2” 以获取更多说明。 准备好创建仿真时,在 Interact ive Labs 框的右上角,单击 OPEN SIMULATOR。
通常显示两种一般类型的食物网在同一个生态系统中相互作用。 放牧食物网(如图中的安大略湖食物网)\(\PageIndex{5}\)) has plants or other photosynthetic organisms at its base, followed by herbivores and various carnivores. A detrital food web consists of a base of organisms that feed on decaying organic matter (dead organisms), called decomposers or detritivores. These organisms are usually bacteria or fungi that recycle organic material back into the biotic part of the ecosystem as they themselves are consumed by other organisms. As all ecosystems require a method to recycle material from dead organisms, most grazing food webs have an associated detrital food web. For example, in a meadow ecosystem, plants may support a grazing food web of different organisms, primary and other levels of consumers, while at the same time supporting a detrital food web of bacteria, fungi, and detrivorous invertebrates feeding off dead plants and animals.
Evolution Connection: Three-spined Stickleback
It is well established by the theory of natural selection that changes in the environment play a major role in the evolution of species within an ecosystem. However, little is known about how the evolution of species within an ecosystem can alter the ecosystem environment. In 2009, Dr. Luke Harmon, from the University of Idaho in Moscow, published a paper that for the first time showed that the evolution of organisms into subspecies can have direct effects on their ecosystem environment.1
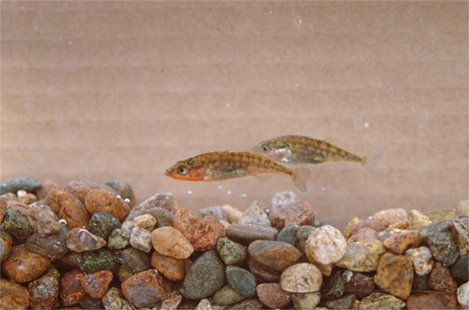
The three-spines stickleback (Gasterosteus aculeatus) is a freshwater fish that evolved from a saltwater fish to live in freshwater lakes about 10,000 years ago, which is considered a recent development in evolutionary time (Figure \(\PageIndex{6}\)). Over the last 10,000 years, these freshwater fish then became isolated from each other in different lakes. Depending on which lake population was studied, findings showed that these sticklebacks then either remained as one species or evolved into two species. The divergence of species was made possible by their use of different areas of the pond for feeding called micro niches.
Dr. Harmon and his team created artificial pond microcosms in 250-gallon tanks and added muck from freshwater ponds as a source of zooplankton and other invertebrates to sustain the fish. In different experimental tanks they introduced one species of stickleback from either a single-species or double-species lake.
Over time, the team observed that some of the tanks bloomed with algae while others did not. This puzzled the scientists, and they decided to measure the water's dissolved organic carbon (DOC), which consists of mostly large molecules of decaying organic matter that give pond-water its slightly brownish color. It turned out that the water from the tanks with two-species fish contained larger particles of DOC (and hence darker water) than water with single-species fish. This increase in DOC blocked the sunlight and prevented algal blooming. Conversely, the water from the single-species tank contained smaller DOC particles, allowing more sunlight penetration to fuel the algal blooms.
This change in the environment, which is due to the different feeding habits of the stickleback species in each lake type, probably has a great impact on the survival of other species in these ecosystems, especially other photosynthetic organisms. Thus, the study shows that, at least in these ecosystems, the environment and the evolution of populations have reciprocal effects that may now be factored into simulation models.

Research into Ecosystem Dynamics: Ecosystem Experimentation and Modeling
The study of the changes in ecosystem structure caused by changes in the environment (disturbances) or by internal forces is called ecosystem dynamics. Ecosystems are characterized using a variety of research methodologies. Some ecologists study ecosystems using controlled experimental systems, while some study entire ecosystems in their natural state, and others use both approaches.
A holistic ecosystem model attempts to quantify the composition, interaction, and dynamics of entire ecosystems; it is the most representative of the ecosystem in its natural state. A food web is an example of a holistic ecosystem model. However, this type of study is limited by time and expense, as well as the fact that it is neither feasible nor ethical to do experiments on large natural ecosystems. To quantify all different species in an ecosystem and the dynamics in their habitat is difficult, especially when studying large habitats such as the Amazon Rainforest, which covers 1.4 billion acres (5.5 million km2) of the Earth’s surface.
For these reasons, scientists study ecosystems under more controlled conditions. Experimental systems usually involve either partitioning a part of a natural ecosystem that can be used for experiments, termed a mesocosm, or by re-creating an ecosystem entirely in an indoor or outdoor laboratory environment, which is referred to as a microcosm. A major limitation to these approaches is that removing individual organisms from their natural ecosystem or altering a natural ecosystem through partitioning may change the dynamics of the ecosystem. These changes are often due to differences in species numbers and diversity and also to environment alterations caused by partitioning (mesocosm) or re-creating (microcosm) the natural habitat. Thus, these types of experiments are not totally predictive of changes that would occur in the ecosystem from which they were gathered.
As both of these approaches have their limitations, some ecologists suggest that results from these experimental systems should be used only in conjunction with holistic ecosystem studies to obtain the most representative data about ecosystem structure, function, and dynamics.
Scientists use the data generated by these experimental studies to develop ecosystem models that demonstrate the structure and dynamics of ecosystems. Three basic types of ecosystem modeling are routinely used in research and ecosystem management: a conceptual model, an analytical model, and a simulation model. A conceptual model is an ecosystem model that consists of flow charts to show interactions of different compartments of the living and nonliving components of the ecosystem. A conceptual model describes ecosystem structure and dynamics and shows how environmental disturbances affect the ecosystem; however, its ability to predict the effects of these disturbances is limited. Analytical and simulation models, in contrast, are mathematical methods of describing ecosystems that are indeed capable of predicting the effects of potential environmental changes without direct experimentation, although with some limitations as to accuracy. An analytical model is an ecosystem model that is created using simple mathematical formulas to predict the effects of environmental disturbances on ecosystem structure and dynamics. A simulation model is an ecosystem model that is created using complex computer algorithms to holistically model ecosystems and to predict the effects of environmental disturbances on ecosystem structure and dynamics. Ideally, these models are accurate enough to determine which components of the ecosystem are particularly sensitive to disturbances, and they can serve as a guide to ecosystem managers (such as conservation ecologists or fisheries biologists) in the practical maintenance of ecosystem health.
Conceptual Models
Conceptual models are useful for describing ecosystem structure and dynamics and for demonstrating the relationships between different organisms in a community and their environment. Conceptual models are usually depicted graphically as flow charts. The organisms and their resources are grouped into specific compartments with arrows showing the relationship and transfer of energy or nutrients between them. Thus, these diagrams are sometimes called compartment models.
To model the cycling of mineral nutrients, organic and inorganic nutrients are subdivided into those that are bioavailable (ready to be incorporated into biological macromolecules) and those that are not. For example, in a terrestrial ecosystem near a deposit of coal, carbon will be available to the plants of this ecosystem as carbon dioxide gas in a short-term period, not from the carbon-rich coal itself. However, over a longer period, microorganisms capable of digesting coal will incorporate its carbon or release it as natural gas (methane, CH4), changing this unavailable organic source into an available one. This conversion is greatly accelerated by the combustion of fossil fuels by humans, which releases large amounts of carbon dioxide into the atmosphere. This is thought to be a major factor in the rise of the atmospheric carbon dioxide levels in the industrial age. The carbon dioxide released from burning fossil fuels is produced faster than photosynthetic organisms can use it. This process is intensified by the reduction of photosynthetic trees because of worldwide deforestation. Most scientists agree that high atmospheric carbon dioxide is a major cause of global climate change.
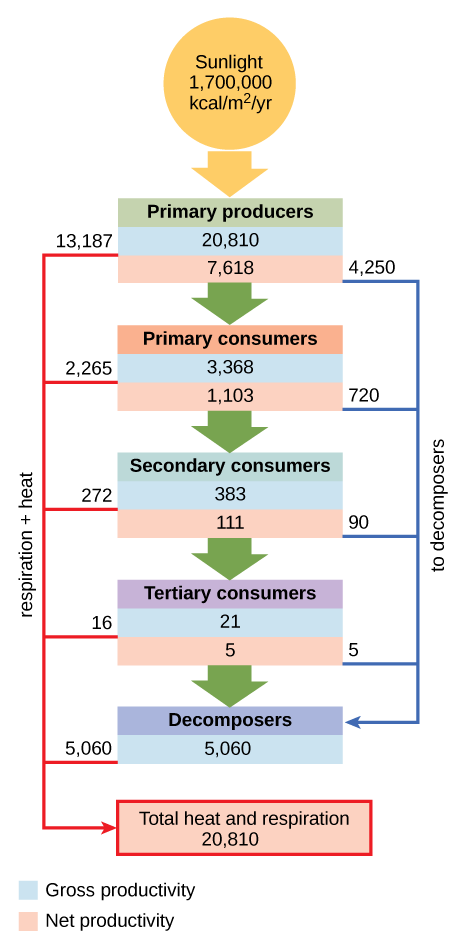
Conceptual models are also used to show the flow of energy through particular ecosystems. Figure \(\PageIndex{7}\) is based on Howard T. Odum’s classical study of the Silver Springs, Florida, holistic ecosystem in the mid-twentieth century.2 This study shows the energy content and transfer between various ecosystem compartments.

Exercise
Why do you think the value for gross productivity of the primary producers is the same as the value for total heat and respiration (20,810 kcal/m2/yr)?
- Answer
-
According to the first law of thermodynamics, energy can neither be created nor destroyed. Eventually, all energy consumed by living systems is lost as heat or used for respiration, and the total energy output of the system must equal the energy that went into it.
Analytical and Simulation Models
The major limitation of conceptual models is their inability to predict the consequences of changes in ecosystem species and/or environment. Ecosystems are dynamic entities and subject to a variety of abiotic and biotic disturbances caused by natural forces and/or human activity. Ecosystems altered from their initial equilibrium state can often recover from such disturbances and return to a state of equilibrium. As most ecosystems are subject to periodic disturbances and are often in a state of change, they are usually either moving toward or away from their equilibrium state. There are many of these equilibrium states among the various components of an ecosystem, which affects the ecosystem overall. Furthermore, as humans have the ability to greatly and rapidly alter the species content and habitat of an ecosystem, the need for predictive models that enable understanding of how ecosystems respond to these changes becomes more crucial.
Analytical models often use simple, linear components of ecosystems, such as food chains, and are known to be complex mathematically; therefore, they require a significant amount of mathematical knowledge and expertise. Although analytical models have great potential, their simplification of complex ecosystems is thought to limit their accuracy. Simulation models that use computer programs are better able to deal with the complexities of ecosystem structure.
A recent development in simulation modeling uses supercomputers to create and run individual-based simulations, which accounts for the behavior of individual organisms and their effects on the ecosystem as a whole. These simulations are considered to be the most accurate and predictive of the complex responses of ecosystems to disturbances.
摘要
生态系统存在于陆地、海上、空中和地下。 要了解环境干扰将如何影响生态系统的结构和动态,就必须采用不同的生态系统建模方法。 概念模型可用于显示生物之间的一般关系以及它们之间的物质或能量流动。 分析模型用于描述线性食物链,而仿真模型最适合整体食物网。
脚注
- 1《自然》(第 458 卷,2009 年 4 月 1 日)
- 2 Howard T. Odum,“佛罗里达州银泉的营养结构和生产力”,《生态专着》27,第 1 期(1957):47—112。
词汇表
- 分析模型
- 使用数学公式创建的生态系统模型,用于预测环境干扰对生态系统结构和动态的影响
- 顶点消费者
- 食物链顶端的生物
- 概念模型
- (也称为隔间模型)生态系统模型,由流程图组成,这些流程图显示了生态系统中有生命和非生物组成部分的不同分区之间的相互作用
- 碎片食物网
- 一种食物网,其中主要消费者由分解者组成;这些分解者通常与同一个生态系统中的放牧食物网有关
- 生态系统
- 活生物体群落及其与非生物环境的相互作用
- 生态系统动态
- 研究由环境变化或内部力量引起的生态系统结构的变化
- 平衡
- 生态系统的稳定状态,所有生物都与环境和彼此保持平衡
- 食物链
- 初级生产者、初级消费者和更高级别消费者链的线性表示,用于描述生态系统的结构和动态
- 食物网
- 由初级生产者、初级消费者和更高级别消费者组成的整体、非线性网络的图形表示,用于描述生态系统的结构和动态
- 放牧食物网
- 一种食物网,其主要生产者要么是陆地上的植物,要么是水中的浮游植物;通常与同一生态系统中的碎屑食物网有关
- 整体生态系统模型
- 该研究试图量化整个生态系统的构成、相互作用和动态;通常受到经济和物流困难的限制,具体取决于生态系统
- mesocosm
- 用于实验的自然生态系统的一部分
- 小宇宙
- 完全在实验室环境中重建自然生态系统以用于实验
- 主要消费者
- 从生态系统的初级生产者那里获取能量的营养等级
- 主要生产者
- 从阳光、无机化学物质或死亡和/或腐烂的有机物质中获取能量的营养水平
- 弹性(生态)
- 生态系统在受到干扰后恢复平衡的速度
- 抵抗(生态)
- 尽管受到干扰,生态系统仍能保持平衡
- 二级消费者
- 通常是吃掉主要消费者的食肉动物
- 仿真模型
- 使用计算机程序创建的生态系统模型,用于对生态系统进行整体建模,并预测环境干扰对生态系统结构和动态的影响
- 第三级消费者
- 吃其他食肉动物的食肉动物
- 营养等级
- 一个物种或一组物种在食物链或食物网中的位置


