
11.8:数据潜水——Island Fox 种群
- Page ID
- 173145

\( \newcommand{\vecs}[1]{\overset { \scriptstyle \rightharpoonup} {\mathbf{#1}} } \)
\( \newcommand{\vecd}[1]{\overset{-\!-\!\rightharpoonup}{\vphantom{a}\smash {#1}}} \)
\( \newcommand{\dsum}{\displaystyle\sum\limits} \)
\( \newcommand{\dint}{\displaystyle\int\limits} \)
\( \newcommand{\dlim}{\displaystyle\lim\limits} \)
\( \newcommand{\id}{\mathrm{id}}\) \( \newcommand{\Span}{\mathrm{span}}\)
( \newcommand{\kernel}{\mathrm{null}\,}\) \( \newcommand{\range}{\mathrm{range}\,}\)
\( \newcommand{\RealPart}{\mathrm{Re}}\) \( \newcommand{\ImaginaryPart}{\mathrm{Im}}\)
\( \newcommand{\Argument}{\mathrm{Arg}}\) \( \newcommand{\norm}[1]{\| #1 \|}\)
\( \newcommand{\inner}[2]{\langle #1, #2 \rangle}\)
\( \newcommand{\Span}{\mathrm{span}}\)
\( \newcommand{\id}{\mathrm{id}}\)
\( \newcommand{\Span}{\mathrm{span}}\)
\( \newcommand{\kernel}{\mathrm{null}\,}\)
\( \newcommand{\range}{\mathrm{range}\,}\)
\( \newcommand{\RealPart}{\mathrm{Re}}\)
\( \newcommand{\ImaginaryPart}{\mathrm{Im}}\)
\( \newcommand{\Argument}{\mathrm{Arg}}\)
\( \newcommand{\norm}[1]{\| #1 \|}\)
\( \newcommand{\inner}[2]{\langle #1, #2 \rangle}\)
\( \newcommand{\Span}{\mathrm{span}}\) \( \newcommand{\AA}{\unicode[.8,0]{x212B}}\)
\( \newcommand{\vectorA}[1]{\vec{#1}} % arrow\)
\( \newcommand{\vectorAt}[1]{\vec{\text{#1}}} % arrow\)
\( \newcommand{\vectorB}[1]{\overset { \scriptstyle \rightharpoonup} {\mathbf{#1}} } \)
\( \newcommand{\vectorC}[1]{\textbf{#1}} \)
\( \newcommand{\vectorD}[1]{\overrightarrow{#1}} \)
\( \newcommand{\vectorDt}[1]{\overrightarrow{\text{#1}}} \)
\( \newcommand{\vectE}[1]{\overset{-\!-\!\rightharpoonup}{\vphantom{a}\smash{\mathbf {#1}}}} \)
\( \newcommand{\vecs}[1]{\overset { \scriptstyle \rightharpoonup} {\mathbf{#1}} } \)
\(\newcommand{\longvect}{\overrightarrow}\)
\( \newcommand{\vecd}[1]{\overset{-\!-\!\rightharpoonup}{\vphantom{a}\smash {#1}}} \)
\(\newcommand{\avec}{\mathbf a}\) \(\newcommand{\bvec}{\mathbf b}\) \(\newcommand{\cvec}{\mathbf c}\) \(\newcommand{\dvec}{\mathbf d}\) \(\newcommand{\dtil}{\widetilde{\mathbf d}}\) \(\newcommand{\evec}{\mathbf e}\) \(\newcommand{\fvec}{\mathbf f}\) \(\newcommand{\nvec}{\mathbf n}\) \(\newcommand{\pvec}{\mathbf p}\) \(\newcommand{\qvec}{\mathbf q}\) \(\newcommand{\svec}{\mathbf s}\) \(\newcommand{\tvec}{\mathbf t}\) \(\newcommand{\uvec}{\mathbf u}\) \(\newcommand{\vvec}{\mathbf v}\) \(\newcommand{\wvec}{\mathbf w}\) \(\newcommand{\xvec}{\mathbf x}\) \(\newcommand{\yvec}{\mathbf y}\) \(\newcommand{\zvec}{\mathbf z}\) \(\newcommand{\rvec}{\mathbf r}\) \(\newcommand{\mvec}{\mathbf m}\) \(\newcommand{\zerovec}{\mathbf 0}\) \(\newcommand{\onevec}{\mathbf 1}\) \(\newcommand{\real}{\mathbb R}\) \(\newcommand{\twovec}[2]{\left[\begin{array}{r}#1 \\ #2 \end{array}\right]}\) \(\newcommand{\ctwovec}[2]{\left[\begin{array}{c}#1 \\ #2 \end{array}\right]}\) \(\newcommand{\threevec}[3]{\left[\begin{array}{r}#1 \\ #2 \\ #3 \end{array}\right]}\) \(\newcommand{\cthreevec}[3]{\left[\begin{array}{c}#1 \\ #2 \\ #3 \end{array}\right]}\) \(\newcommand{\fourvec}[4]{\left[\begin{array}{r}#1 \\ #2 \\ #3 \\ #4 \end{array}\right]}\) \(\newcommand{\cfourvec}[4]{\left[\begin{array}{c}#1 \\ #2 \\ #3 \\ #4 \end{array}\right]}\) \(\newcommand{\fivevec}[5]{\left[\begin{array}{r}#1 \\ #2 \\ #3 \\ #4 \\ #5 \\ \end{array}\right]}\) \(\newcommand{\cfivevec}[5]{\left[\begin{array}{c}#1 \\ #2 \\ #3 \\ #4 \\ #5 \\ \end{array}\right]}\) \(\newcommand{\mattwo}[4]{\left[\begin{array}{rr}#1 \amp #2 \\ #3 \amp #4 \\ \end{array}\right]}\) \(\newcommand{\laspan}[1]{\text{Span}\{#1\}}\) \(\newcommand{\bcal}{\cal B}\) \(\newcommand{\ccal}{\cal C}\) \(\newcommand{\scal}{\cal S}\) \(\newcommand{\wcal}{\cal W}\) \(\newcommand{\ecal}{\cal E}\) \(\newcommand{\coords}[2]{\left\{#1\right\}_{#2}}\) \(\newcommand{\gray}[1]{\color{gray}{#1}}\) \(\newcommand{\lgray}[1]{\color{lightgray}{#1}}\) \(\newcommand{\rank}{\operatorname{rank}}\) \(\newcommand{\row}{\text{Row}}\) \(\newcommand{\col}{\text{Col}}\) \(\renewcommand{\row}{\text{Row}}\) \(\newcommand{\nul}{\text{Nul}}\) \(\newcommand{\var}{\text{Var}}\) \(\newcommand{\corr}{\text{corr}}\) \(\newcommand{\len}[1]{\left|#1\right|}\) \(\newcommand{\bbar}{\overline{\bvec}}\) \(\newcommand{\bhat}{\widehat{\bvec}}\) \(\newcommand{\bperp}{\bvec^\perp}\) \(\newcommand{\xhat}{\widehat{\xvec}}\) \(\newcommand{\vhat}{\widehat{\vvec}}\) \(\newcommand{\uhat}{\widehat{\uvec}}\) \(\newcommand{\what}{\widehat{\wvec}}\) \(\newcommand{\Sighat}{\widehat{\Sigma}}\) \(\newcommand{\lt}{<}\) \(\newcommand{\gt}{>}\) \(\newcommand{\amp}{&}\) \(\definecolor{fillinmathshade}{gray}{0.9}\)概述
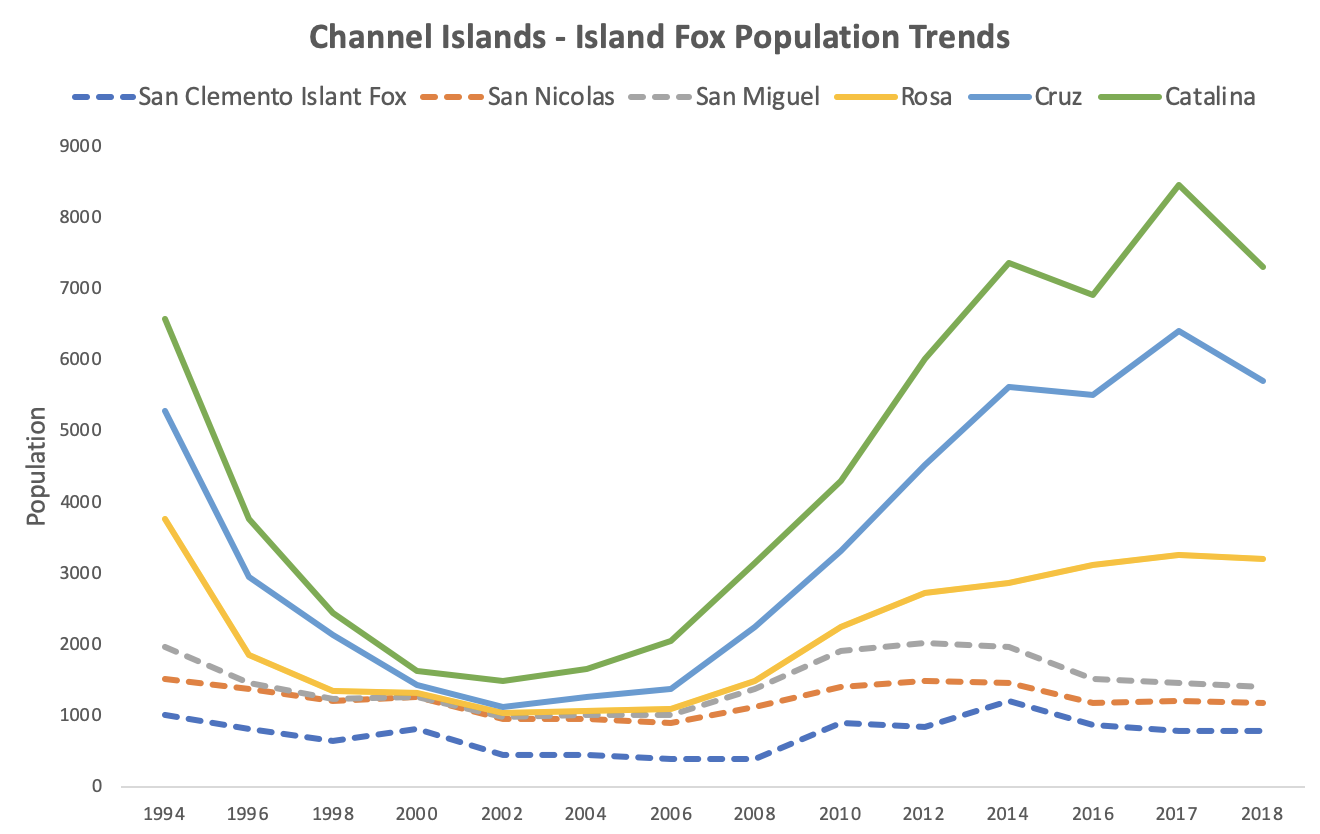
Island Fox 保护工作组和 Friends of the Island Fox 非营利组织努力持续为研究和保护项目提供资金,以确保岛狐的持续生存。 此外,他们还开展了有关岛狐作为濒危物种的教育宣传计划,以获得公众的支持。 每年6月,Island Fox保护工作组开会讨论最新情况并规划未来。 在2019年的会议上,他们讨论了六个岛狐亚种的种群趋势,并确定了这些种群对未来亚种轨迹的意义。 这次会议的结果可以在下图和表格中看出:
表\(\PageIndex{a}\):根据狐狸种群和岛屿面积,2019年岛狐亚种的指定状态。 Rachel Schleiger(CC-BY-NC)的图表根据 2019年Island Fox状态更新中的数据进行了修改。
| 岛屿 | 岛屿面积 | 福克斯人口 | 状态 |
|---|---|---|---|
| 圣米格尔 | 小 | 171 | 担心 |
| 圣尼古拉斯 | 小 | 400 | 已改进 |
| 圣罗莎 | 大号 | 1862 | 稳定 |
| 圣克鲁斯 | 大号 | 2462 | 稳定 |
| 圣卡塔利娜 | 大号 | 1571 | 稳定 |
| 圣克莱门托 | 小 | 778 | 稳定 |
问题
- 什么是自变(解释)变量和因属(响应)变量?
- 作者想用这张图表和表格回答什么问题?
- 你认为岛狐的哪个亚种最稳定? 为什么?
- 对于大多数岛狐亚种来说,哪一年不好(这意味着种群估计值非常低)?
- 如图所示,每年估计每个亚种的种群。 你为什么认为在保护计划中选择了年度估算而不是更长的时间间隔?
来自上方图表的原始数据
表\(\PageIndex{b}\):岛狐亚种群趋势的原始数据(实线 = 大岛亚种,虚线 = 小岛亚种)。 Rachel Schleiger(CC-BY-NC)的图表根据 2019年Island Fox状态更新中的数据进行了修改。
| 年 | 圣克莱门托 | 圣尼古拉斯 | 圣米格尔 | 圣罗莎 | 圣克鲁斯 | 圣卡塔利娜 |
|---|---|---|---|---|---|---|
| 1994 | 1000 | 520 | 450 | 1800 | 1500 | 1300 |
| 1996 | 810 | 550 | 100 | 400 | 1100 | 800 |
| 1998 | 650 | 550 | 40 | 100 | 800 | 300 |
| 2000 | 800 | 450 | 20 | 50 | 100 | 200 |
| 2002 | 450 | 500 | 25 | 60 | 90 | 350 |
| 2004 | 450 | 500 | 50 | 70 | 200 | 375 |
| 2006 | 400 | 506 | 100 | 80 | 300 | 650 |
| 2008 | 400 | 725 | 260 | 100 | 750 | 900 |
| 2010 | 900 | 500 | 500 | 350 | 1050 | 1000 |
| 2012 | 850 | 640 | 525 | 700 | 1800 | 1500 |
| 2014 | 1200 | 263 | 510 | 900 | 2750 | 1750 |
| 2016 | 860 | 329 | 329 | 1600 | 2400 | 1400 |
| 2017 | 775 | 255 | 255 | 1800 | 3150 | 2050 |
| 2018 | 790 | 400 | 200 | 1800 | 2500 | 1600 |
归因
Rachel Schleiger(CC-BY-NC)